


Bitcoin, Altcoins Rebound As Dip Buyers Supply Volume
Key points:
-
Bitcoin is nearing the support of the large range, indicating that a relief rally is possible in the near term.
-
Several major altcoins are trying to start a relief rally, but they are likely to meet significant resistance from the bears at higher levels.
Bitcoin (BTC) reclaimed the $110,000 level, but it remains to be seen whether the bounce is sustainable. Glassnode analysts said in a post on X that long-term holders realized 3.4 million BTC in profit, and exchange-funds inflows slowed down after the Federal Reserve cut rates on Sept. 17, signaling exhaustion and downside risk.
According to Farside Investors data, the US spot BTC ETFs have seen net outflows of $479 million this week. That suggests institutional demand is slowing down. BTC’s fall on Thursday pulled the Crypto Fear & Greed Index into the “fear” category on Friday.
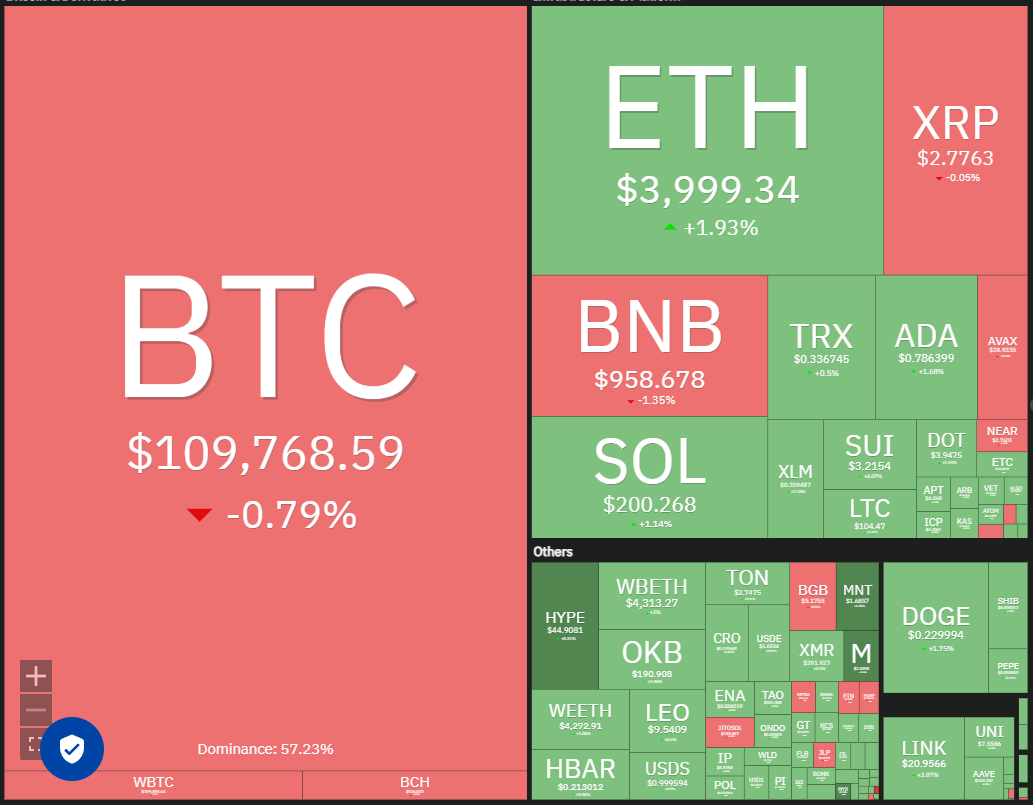
BTC’s weakness has pulled several major altcoins lower. That suggests a negative sentiment, where traders are dumping their positions in a hurry. A minor ray of hope for the bulls is that BTC has still not broken below the support of the $107,000 to $124,474 range.
Could BTC rebound off the $107,000 support with strength, pulling altcoins higher? Let’s analyze the charts of the top 10 cryptocurrencies to find out.
Bitcoin price prediction
BTC turned down from the 20-day exponential moving average ($113,217) on Thursday, indicating that the sentiment is turning negative.
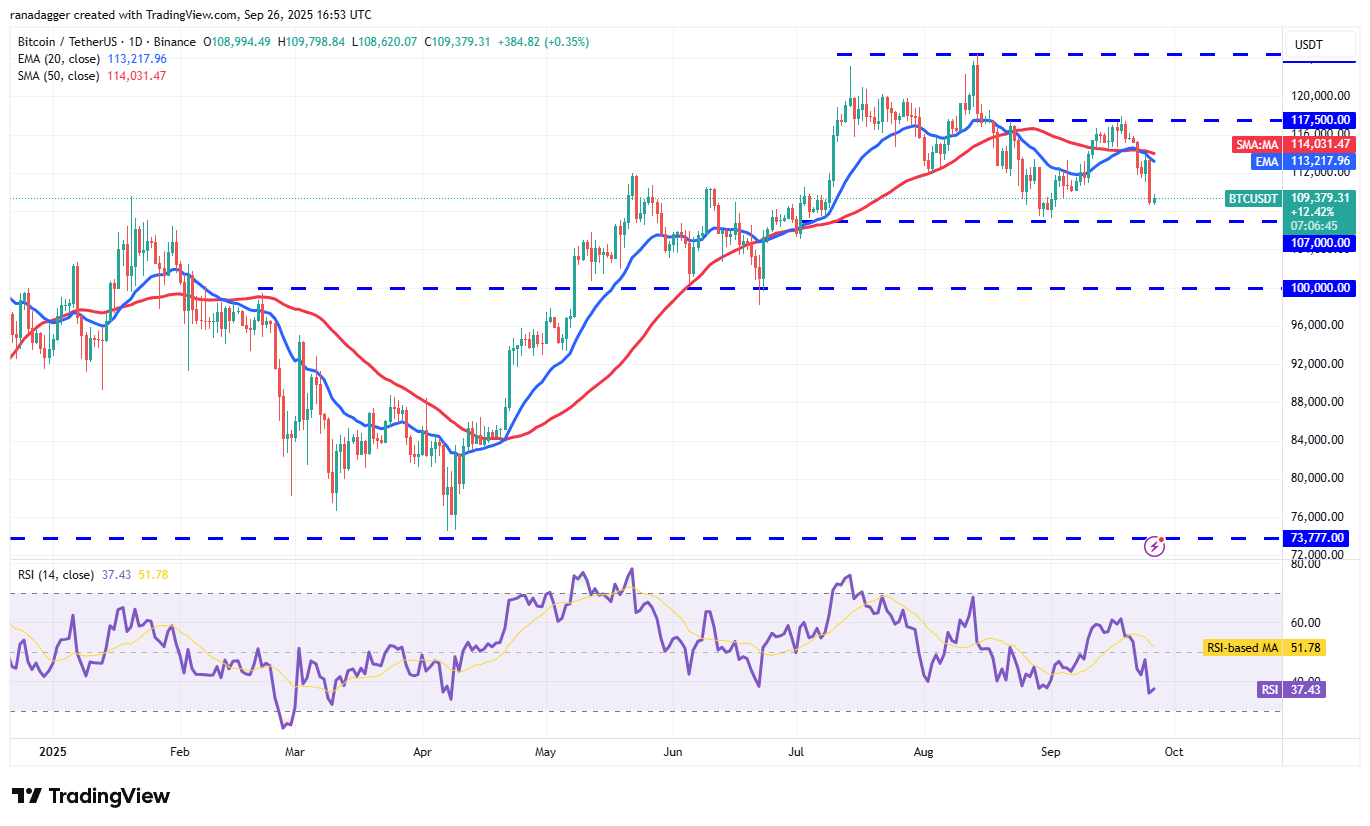
Sellers will have to yank the price below the $107,000 support to complete a double-top pattern. If they manage to do that, the selling could accelerate and the BTC/USDT pair could drop to $100,000. Buyers are expected to defend the $100,000 level with all their might because a break below it clears the path for a collapse to the pattern target of $89,526.
Contrarily, if the Bitcoin price turns up and breaks above the moving averages, it signals that the pair may oscillate inside the $107,000 to $124,474 range for a few more days.
Ether price prediction
Ether (ETH) extended its fall below the $4,060 support on Thursday, indicating that the bears have kept up the pressure.
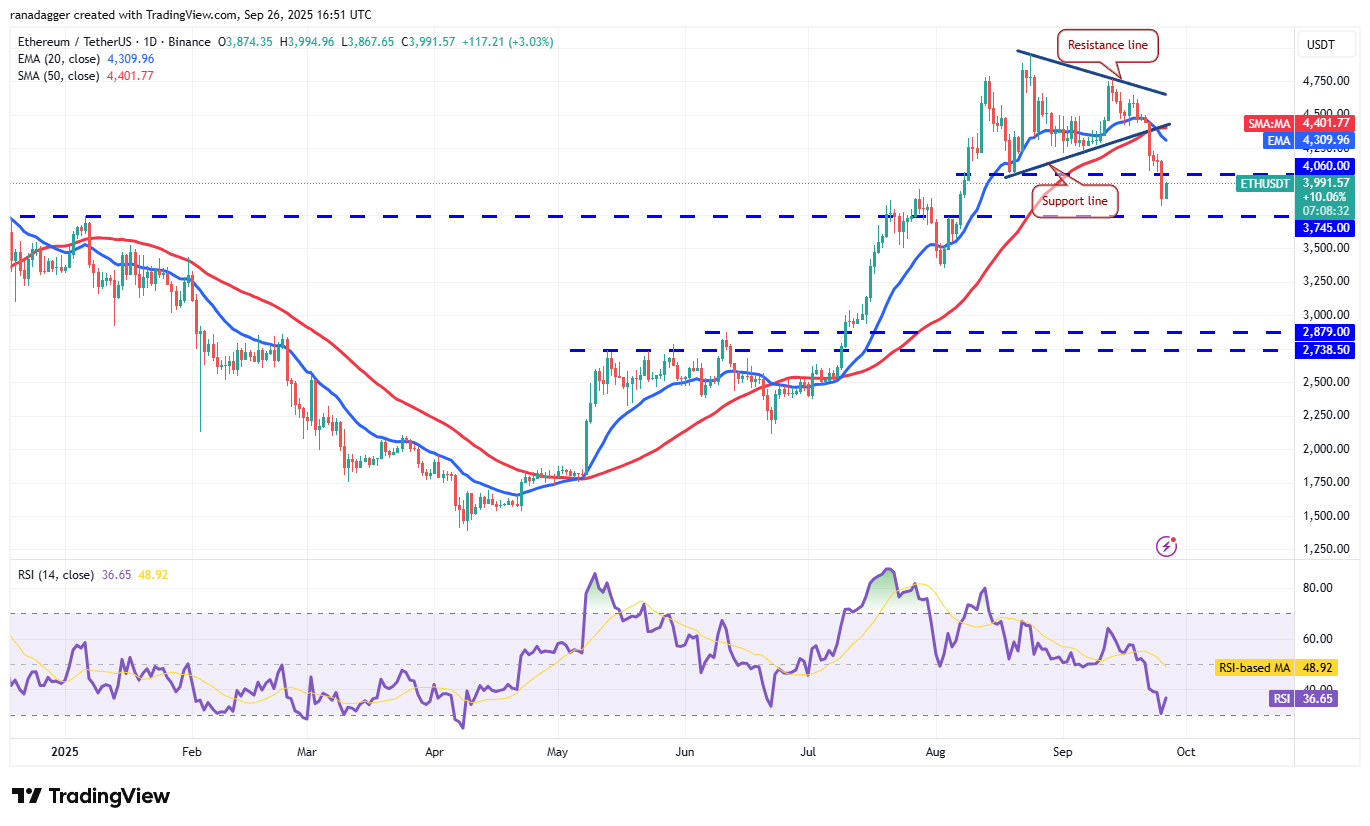
The moving averages have completed a bearish crossover, and the relative strength index (RSI) is in the negative territory, signaling that the path of least resistance is to the downside. If the $3,745 support cracks, the ETH/USDT pair could tumble to the pattern target of $3,426 and then to $3,350.
The bulls are likely to face significant selling from the bears at the moving averages and then at the resistance line.
XRP price prediction
XRP (XRP) turned down from the 50-day simple moving average ($2.98) on Wednesday and fell to the solid support at $2.69 on Thursday.
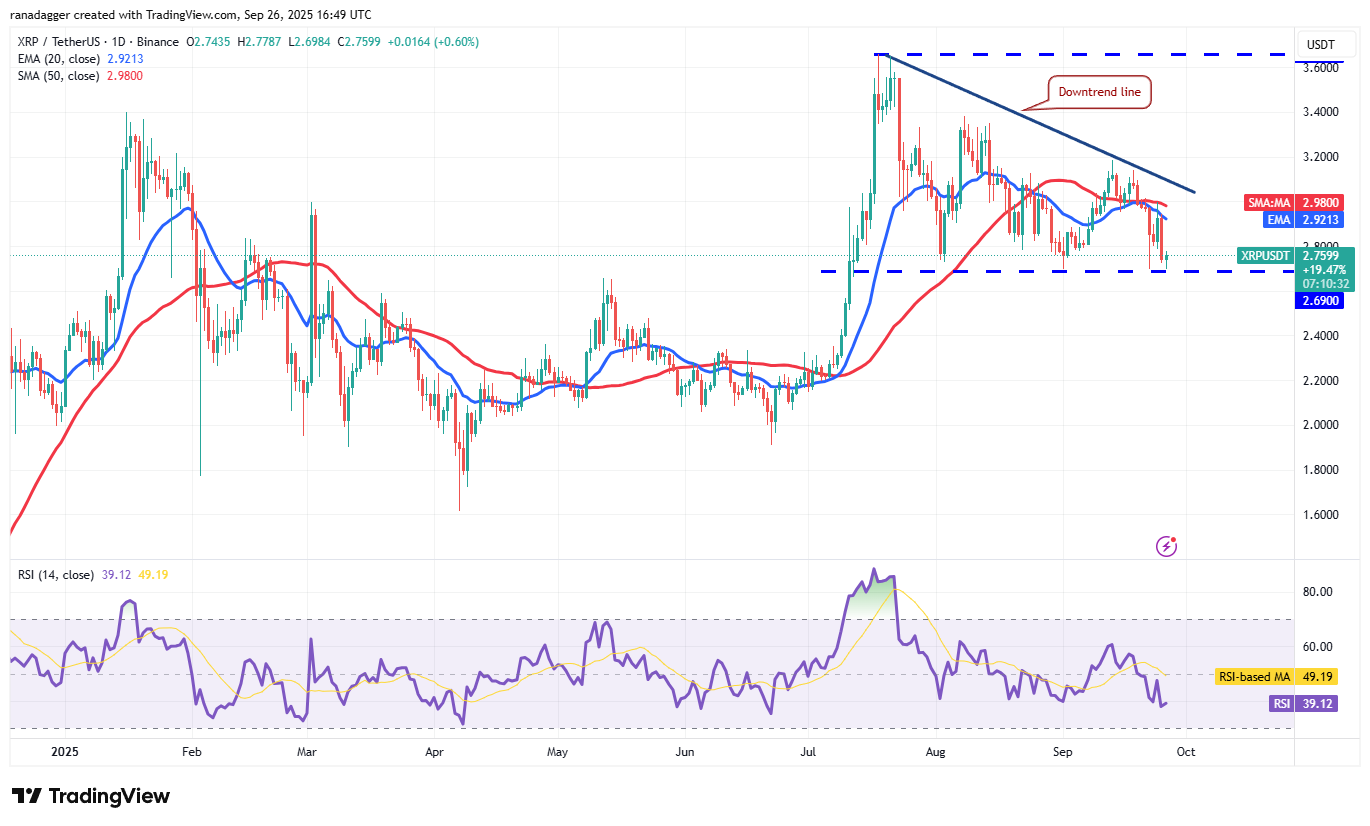
The repeated retest of a support level tends to weaken it. If the price breaks and closes below $2.69, the XRP/USDT pair will complete a bearish descending triangle pattern. That increases the risk of a fall toward $2.20.
Any relief rally is expected to face selling at the moving averages and then at the downtrend line. The bulls will have to thrust and maintain the price above the downtrend line to indicate a comeback.
BNB price prediction
BNB (BNB) bounced off the 20-day EMA ($955) on Tuesday, but the recovery fizzled out at $1,034 on Wednesday.
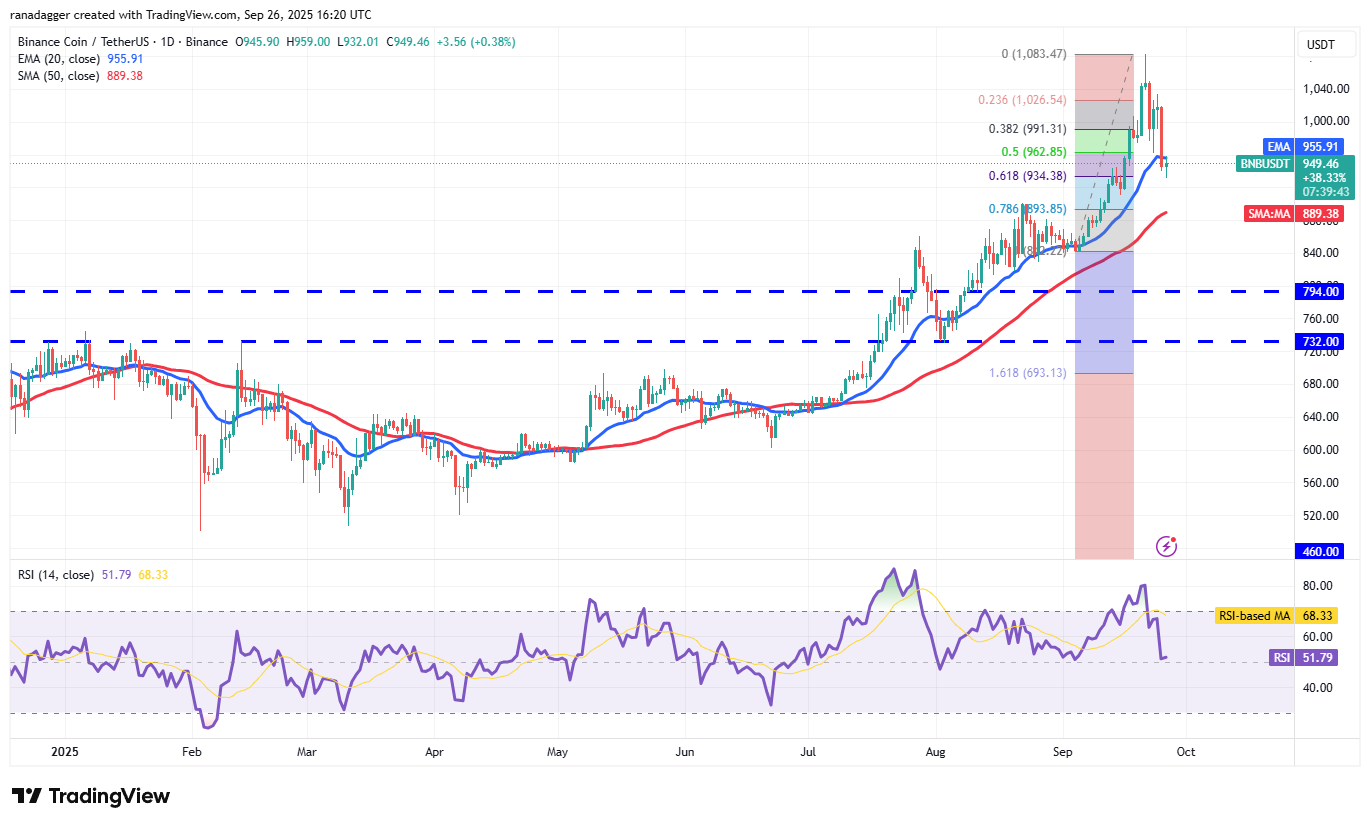
The bears resumed selling on Thursday and pulled the BNB price below the 20-day EMA. There is support at the 61.8% Fibonacci retracement level of $934, but if the level cracks, the BNB/USDT pair could dump to the 50-day SMA ($889).
If buyers want to prevent the downside, they will have to swiftly push and maintain the price above the 20-day EMA. The bulls will be back in the game after they thrust the pair above $1,034.
Solana price prediction
Buyers tried to halt Solana’s (SOL) fall at the 50-day SMA ($207) on Wednesday, but sustained selling by the bears pulled the price lower on Thursday.
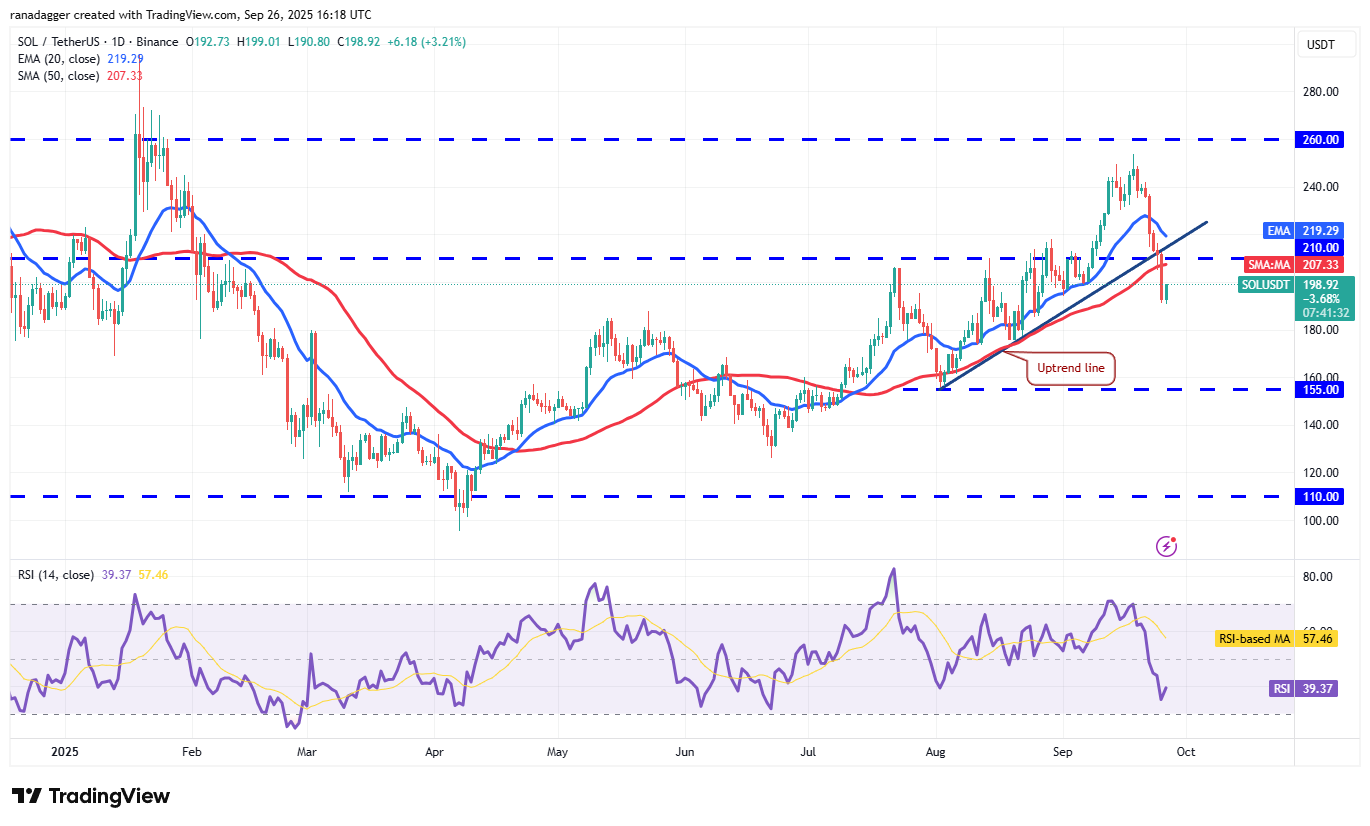
The downsloping 20-day EMA ($219) and the RSI below 40 suggest that the advantage has tilted in favor of the bears. Attempts to start a recovery are likely to be met with solid selling at the 20-day EMA. If the price turns down sharply from the 20-day EMA, the SOL/USDT pair may nosedive to $175.
Buyers have an uphill task ahead of them. They will have to drive the Solana price above the 20-day EMA to signal strength. The pair may then ascend toward $260.
Dogecoin price prediction
The failure of the bulls to push Dogecoin (DOGE) above the 20-day EMA ($0.24) on Wednesday signals that the bears are selling on rallies.
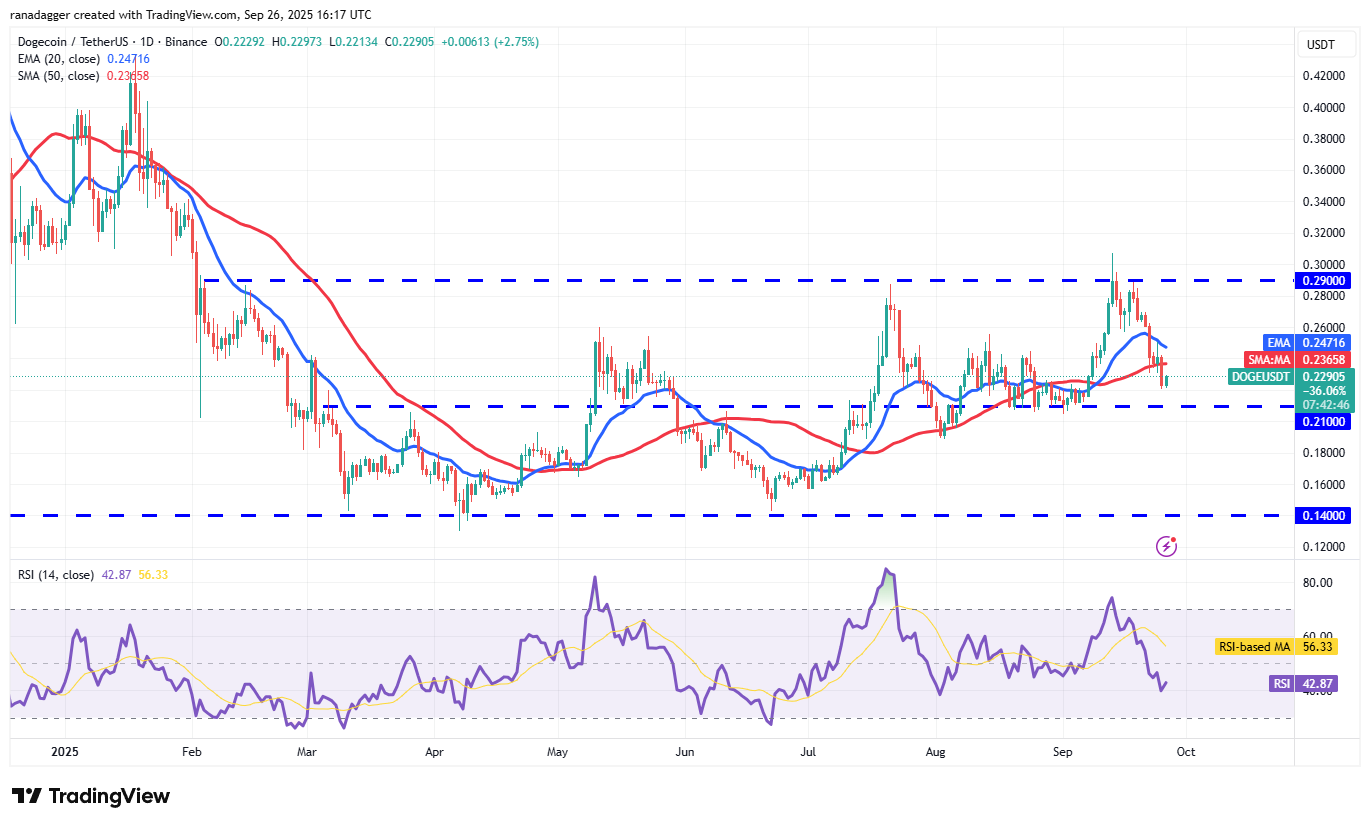
The DOGE/USDT pair could drop to the solid support at $0.21. Buyers will try to vigorously guard the $0.21 level because a break and close below it may sink the Dogecoin price to $0.18. That suggests the pair may extend its stay inside the $0.14 to $0.29 range for a while longer.
The first sign of strength will be a break above the 20-day EMA. That opens the doors for a rally to the stiff overhead resistance of $0.29.
Cardano price prediction
Cardano (ADA) continued lower and slipped below the $0.78 support on Thursday, indicating that the bears have kept up the pressure.
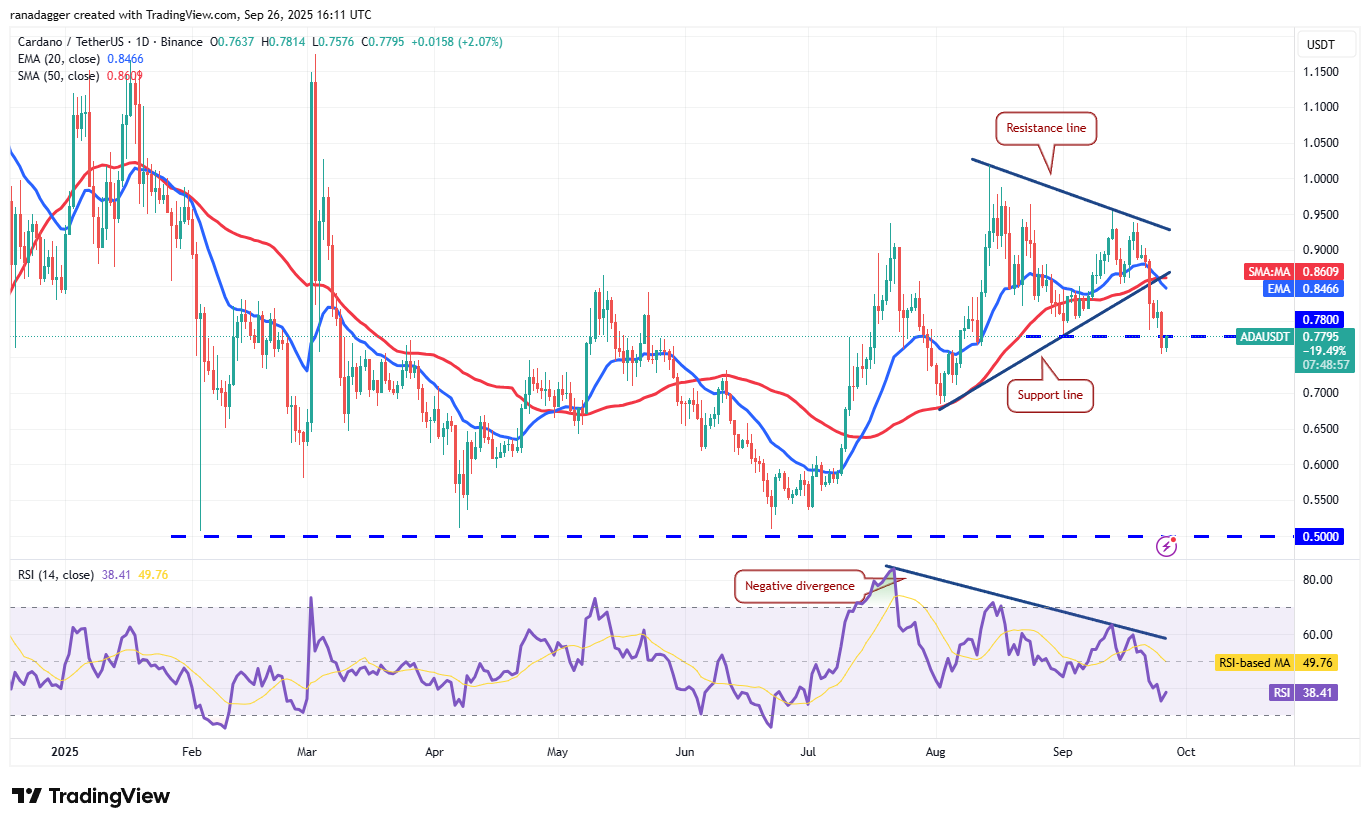
Buyers are trying to push the price back above $0.78 but may face significant selling from the bears at the current level and on any rise toward the 20-day EMA ($0.84). If the price turns down sharply from the 20-day EMA, the ADA/USDT pair could nosedive to the next strong support at $0.68.
Contrarily, if buyers push the Cardano price above the moving averages, it suggests solid demand at lower levels. The pair may then climb to the resistance line, where the bears are expected to pose a substantial challenge.
Related: Bitcoin price ignores PCE inflation as bears eat through $109K support
Hyperliquid price prediction
Hyperliquid (HYPE) continued its correction and reached the $40 support on Thursday, where the bulls are mounting a strong defense.
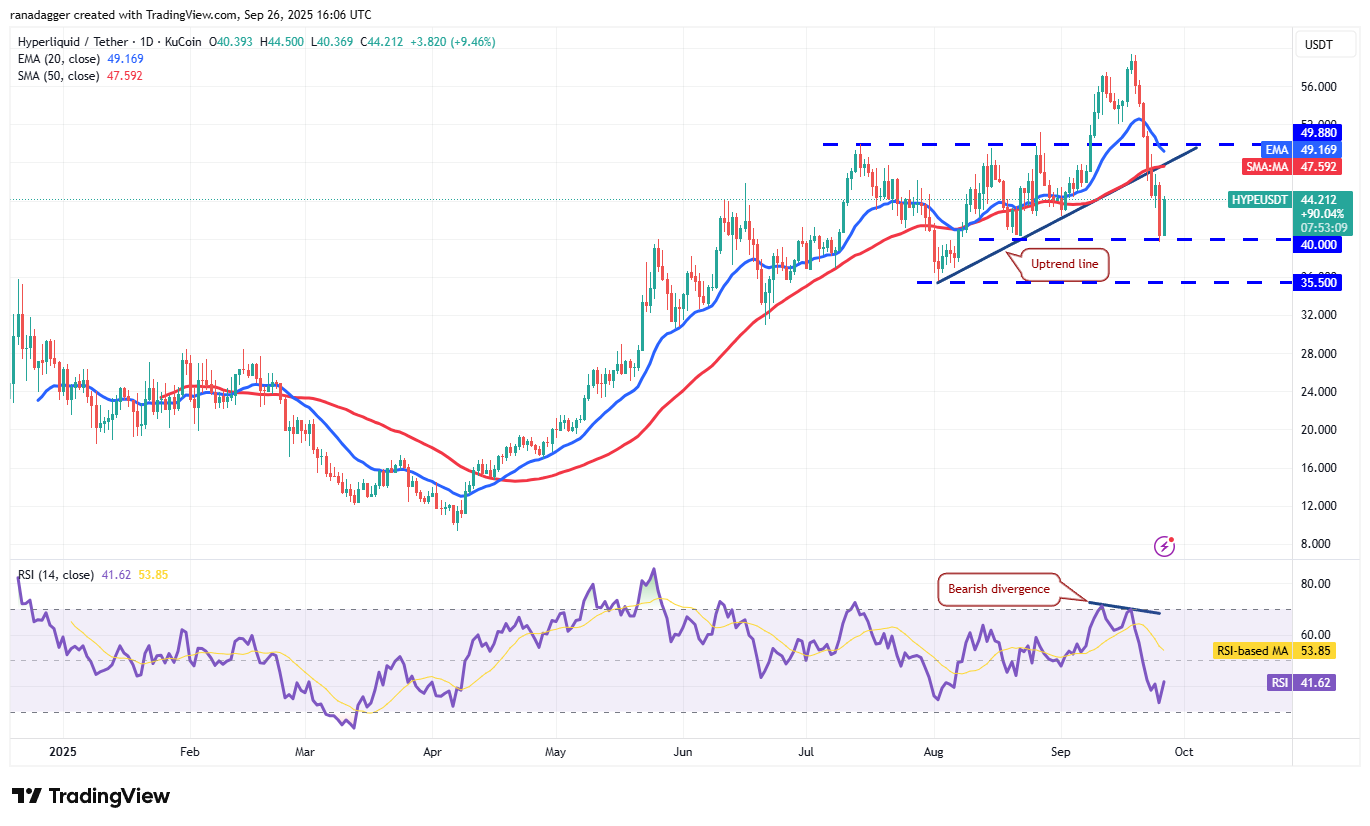
The relief rally is expected to face selling at the moving averages. If the price turns down sharply from the moving averages, the bears will make one more attempt to sink the HYPE/USDT pair below $40. If they can pull it off, the Hyperliquid price could plummet to $35.50.
On the contrary, if the price continues higher and breaks above $49.88, it suggests that the corrective phase may be over. The pair may then rally toward $59.
Chainlink price prediction
Chainlink (LINK) dipped to the support line of the descending channel pattern, where the buyers are expected to step in.
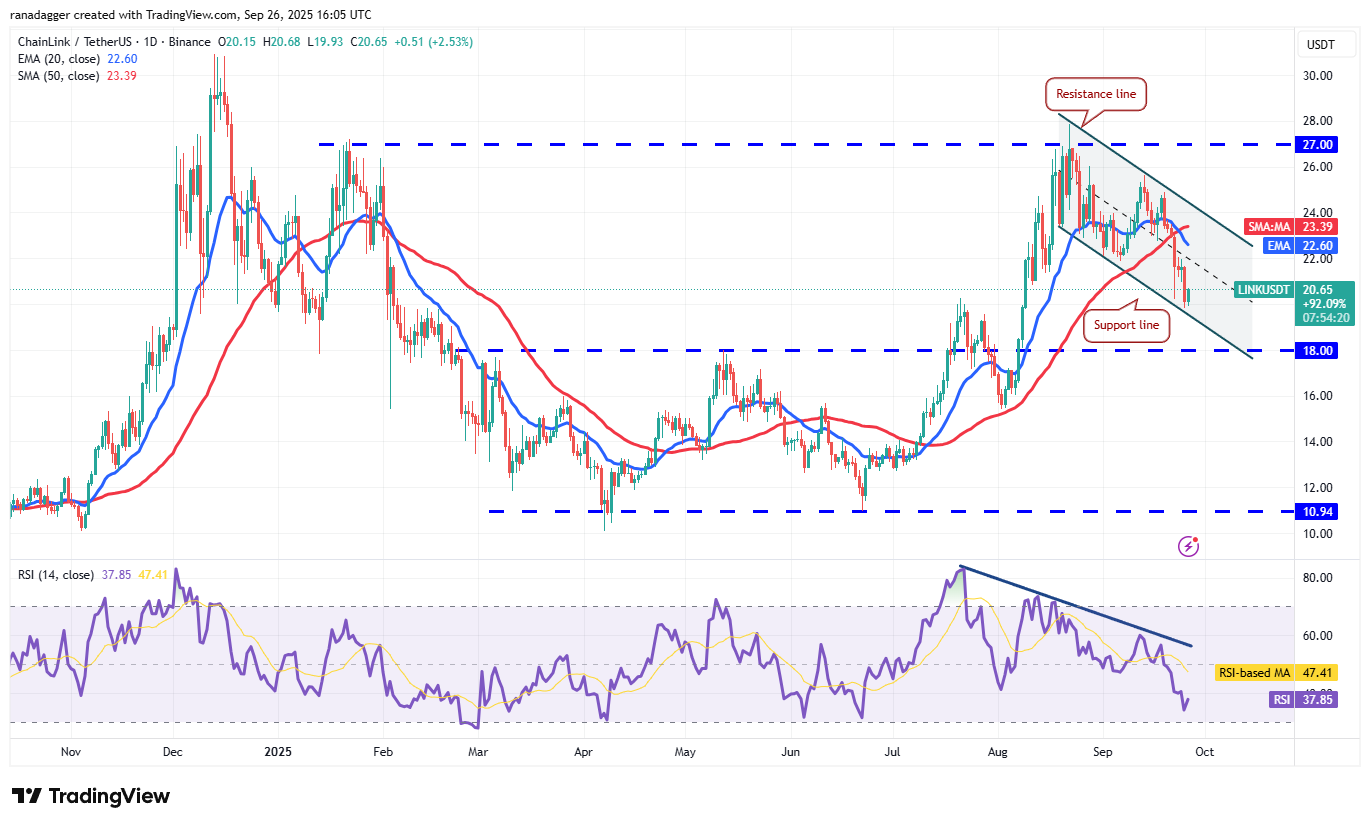
Any recovery attempt from the support line is likely to face selling at the 20-day EMA ($22.60). If the price turns down sharply from the 20-day EMA, the bears will make one more attempt to sink the LINK/USDT pair below the descending channel. If they manage to do that, the Chainlink price could sink to $18 and subsequently to $16.
Buyers will have to swiftly push the price above the 20-day EMA to prevent the downside. The pair may then climb to the resistance line of the channel.
Avalanche price prediction
Avalanche (AVAX) turned down sharply on Thursday and plunged below the 20-day EMA ($30.09), indicating that the bears are rushing to the exit.
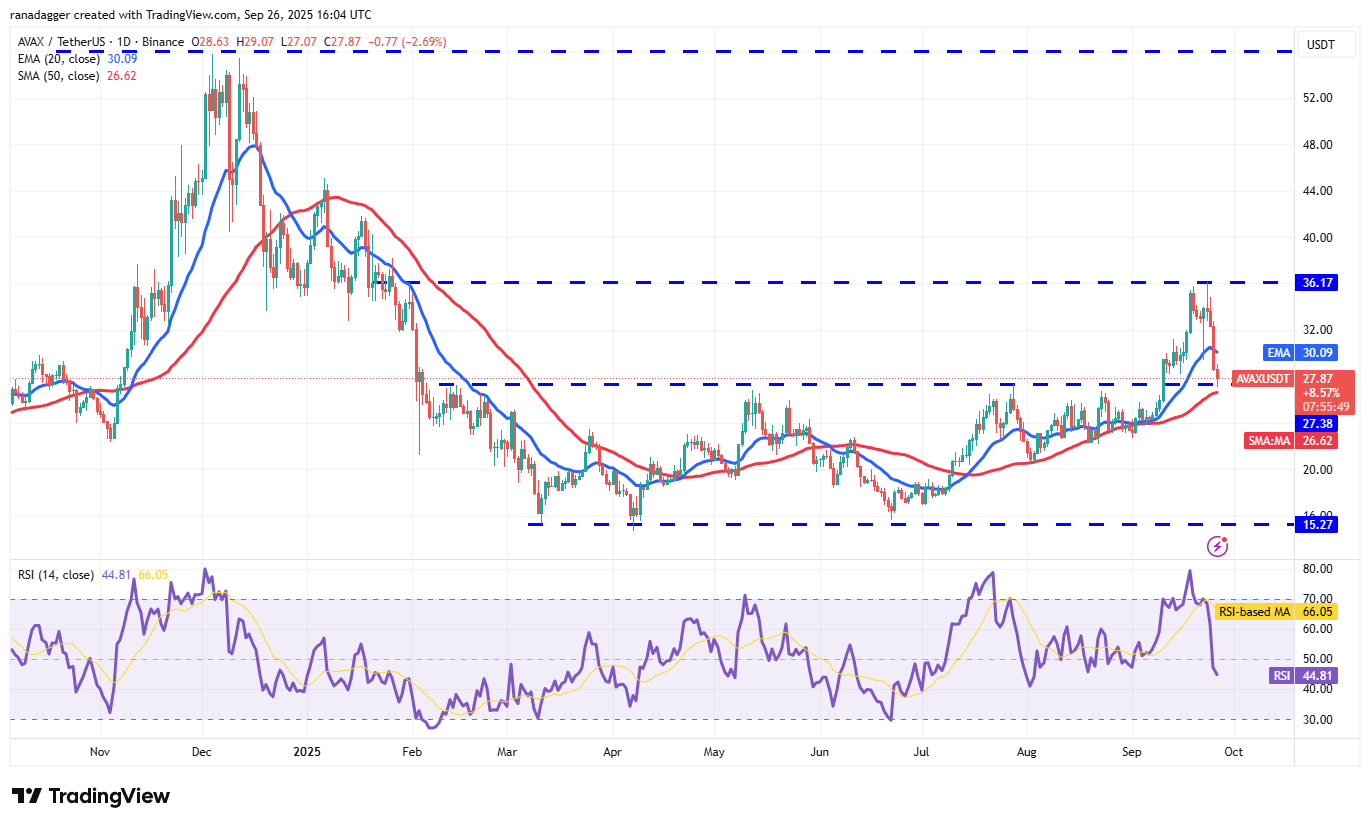
The AVAX/USDT pair has declined to the 50-day SMA ($26.62), which is likely to attract buyers. If the price rebounds off the 50-day SMA and rises above the 20-day EMA, it suggests buying at lower levels. The Avalanche price could then consolidate between $26.50 and $36.17 for some time.
Instead, if sellers sink the price below the 50-day SMA, the pair could descend to $22.50. That brings the large $15.27 to $36.17 range into play.
This article does not contain investment advice or recommendations. Every investment and trading move involves risk, and readers should conduct their own research when making a decision.